

Share


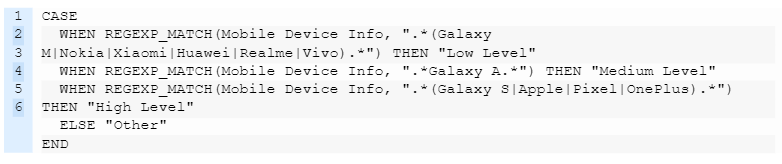
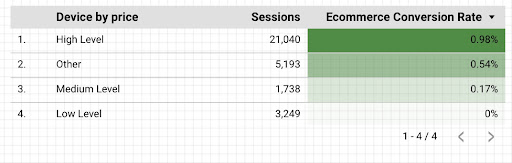
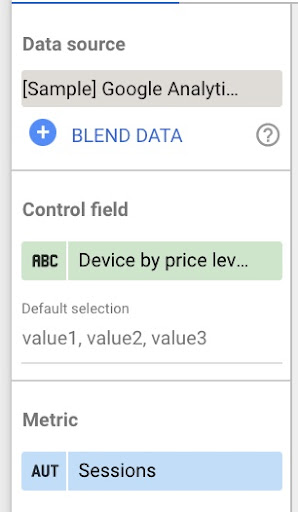
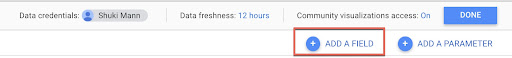
Smart Filters in Data Studio


Trending Articles
Get exclusive CMO tips that I only share with email subscribers.

Don't forget to share this article!
PPC Marketing Expert?
Get things done with Adcore Marketing Cloud.
5 essential PPC tools under one roof.